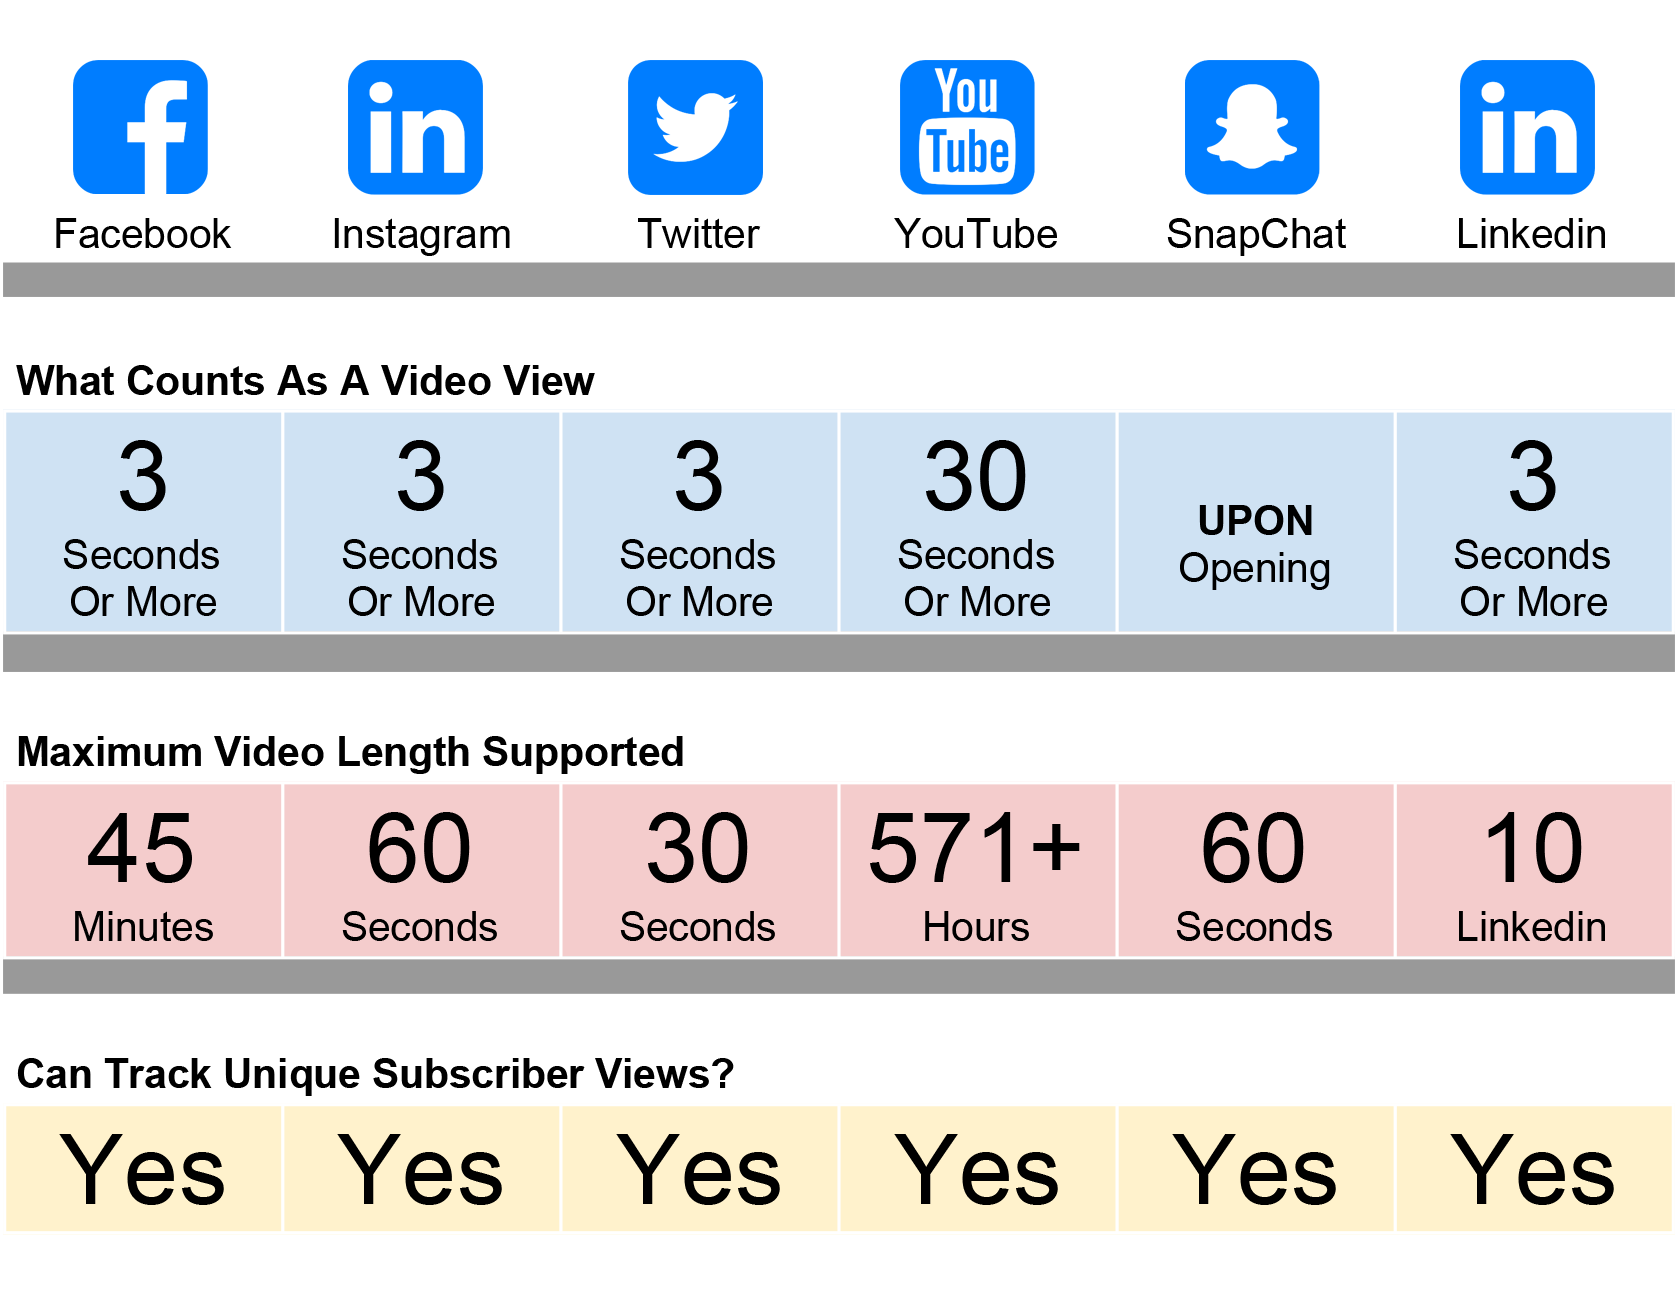
A View By Social Media Channel
 Facebook
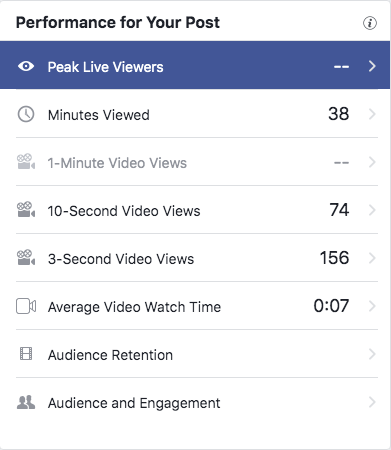
- Minutes viewed
- Unique viewers
- Video views
- 10-Second views
- Video average watch time
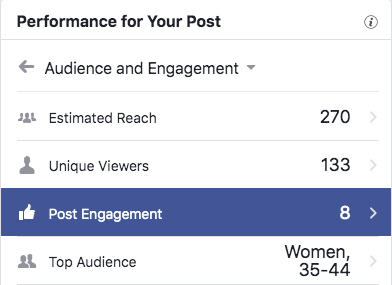
- Audience and engagement (People Reached, Post Engagement, Top Audience, and Top Location)
- Facebook also provides a bunch of other metrics for the Facebook post with the video such as reactions, comments, shares, and post clicks, under “Post”.
 Instagram
- Views
- Likes (and who liked the video)
If you are using an Instagram business profile, you’ll get the following metrics as well:
- Impressions
- Reach
- Engagement
 Twitter
- Impressions
- Media views
- Total engagements (e.g. media engagements, likes, detail expanded, etc.)
- Video views
- Completion rate (i.e. Total number of completed views divided by the total number of video starts)
 YouTube
- Watch time
- Views
- Average view duration
- Likes and dislikes
- Comments
- Shares
- Videos in playlists
- Subscribers
- Audience Retention
- Demographics (Age, gender, and geography)
- Traffic sources
- Playback locations
 SnapChat (Ads Only)
- Video Views: The total number of impressions that meet the qualifying video view criteria of at least 2 seconds of consecutive watch time or a swipe up action on the Top Snap
- Quartiles:
- 25% Quartile: The number of Snaps watched to 25% of duration
- 50% Quartile: The number of Snaps watched to 50% of duration
- 75% Quartile: The number of Snaps watched to 75% of duration
- Completions: The number of Snaps watched to 97% of duration
- Avg Screen Time: The average number of seconds spent watching your Ad across all paid impressions
- Screen time starts recording as soon as the media is fully rendered on the device and the autoplay video starts.
 Linkedin (Ads Only)
- Views: At least two continuous seconds of playback while the video is at least 50% on screen, or a click on the CTA, whichever comes first
- Views at 25%: The number of times your video was watched at 25% of its length, including watches that skipped to this point
- Views at 50%: The number of times your video was watched at 50% of its length, including watches that skipped to this point
- Views at 75%: The number of times your video was watched at 75% of its length, including watches that skipped to this point
- Complete: The number of times your video was watched at 97-100% of its length, including watches that skipped to this point
- Completion Rate: Number of completions divided by number of views, multiplied by 100
- Avg CPV: Average cost per view
- Full Screen Plays: Total number of clicks to view video in full screen
Myth Case Studies
Video views, on all channels, is closer to impression counting than unique view count. Unique views, per video, can be found in metrics such as reach, subscribers, and anything that is clearly defined as pulling unique attributes.
Example 1
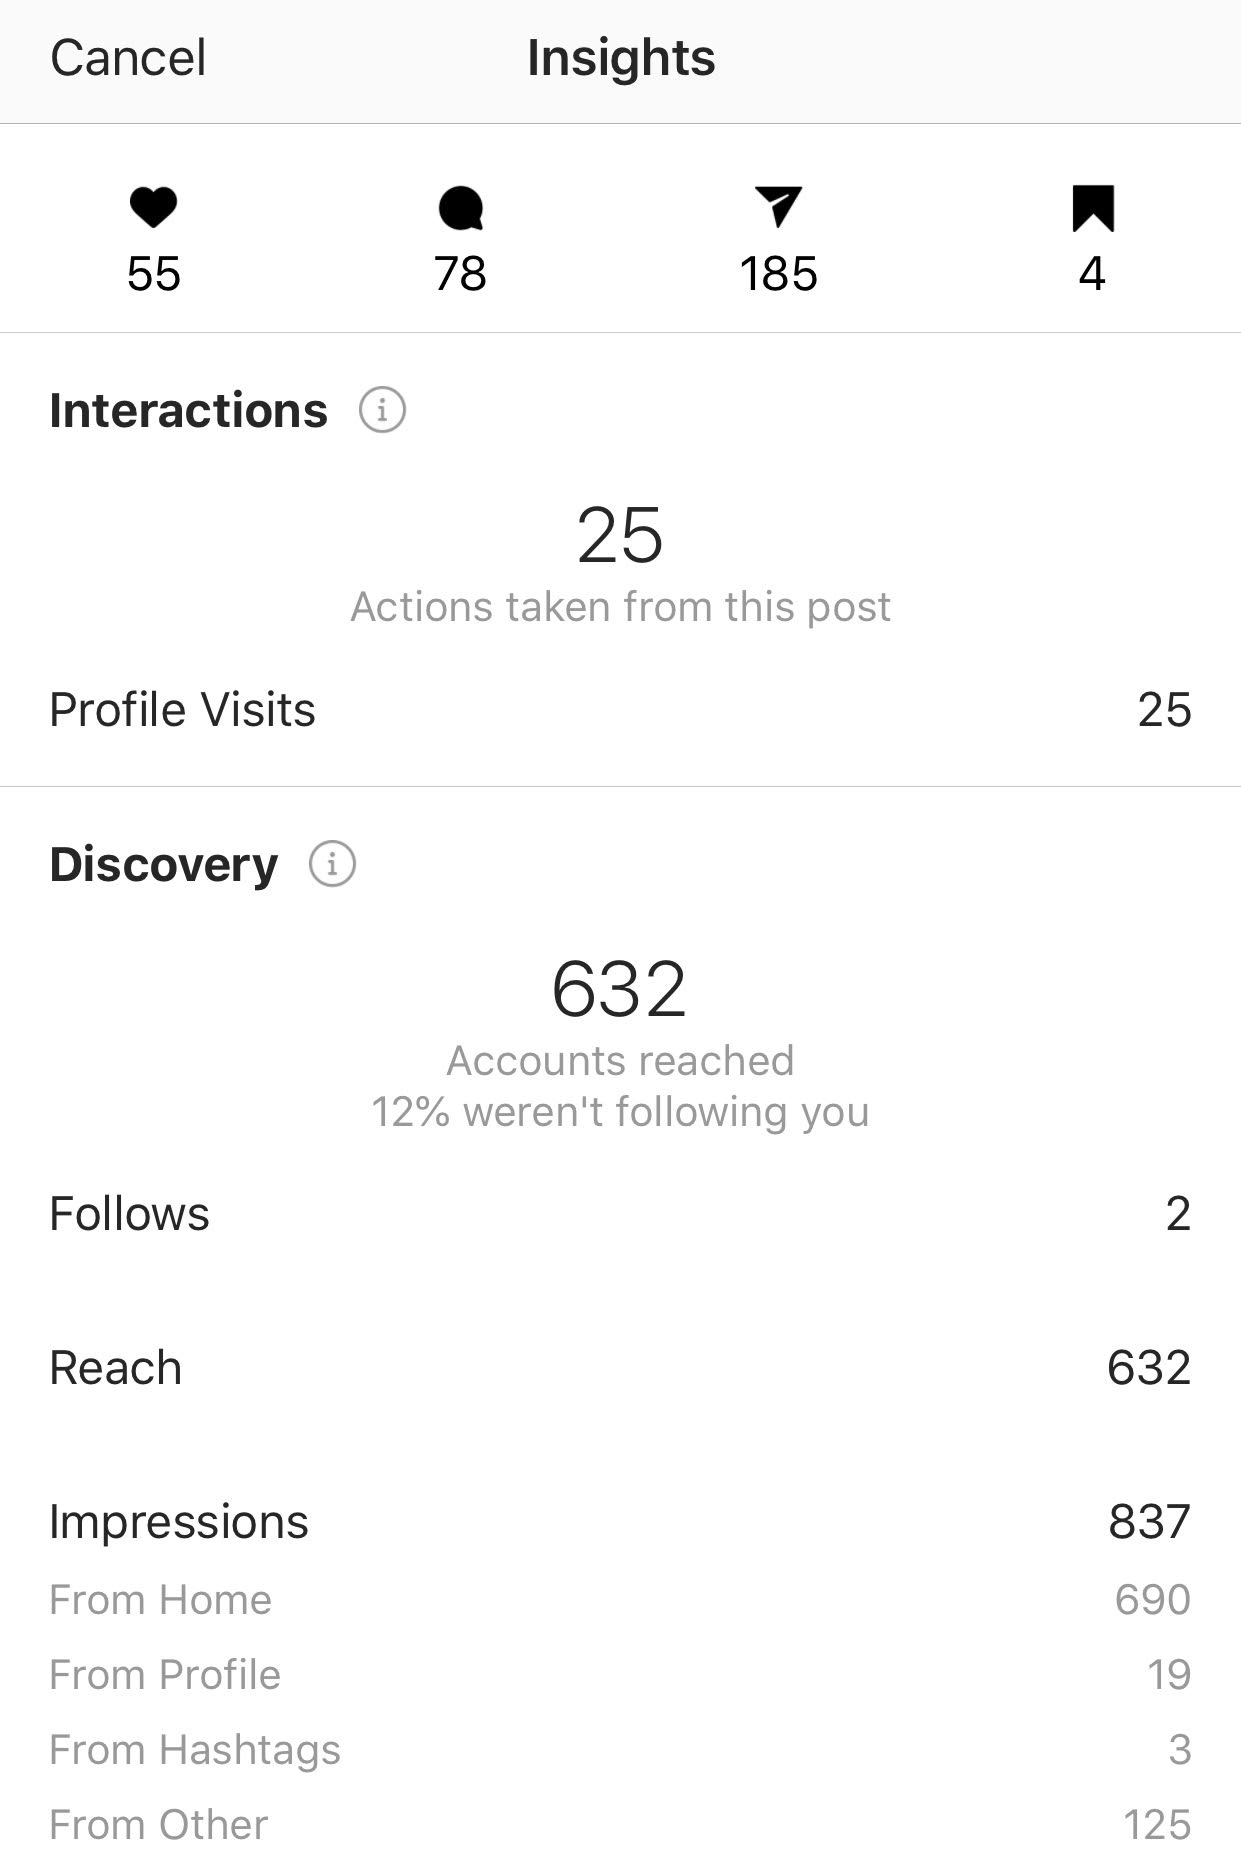
Here is a snapshot from Instagram Insights:
Video Views = 3370