
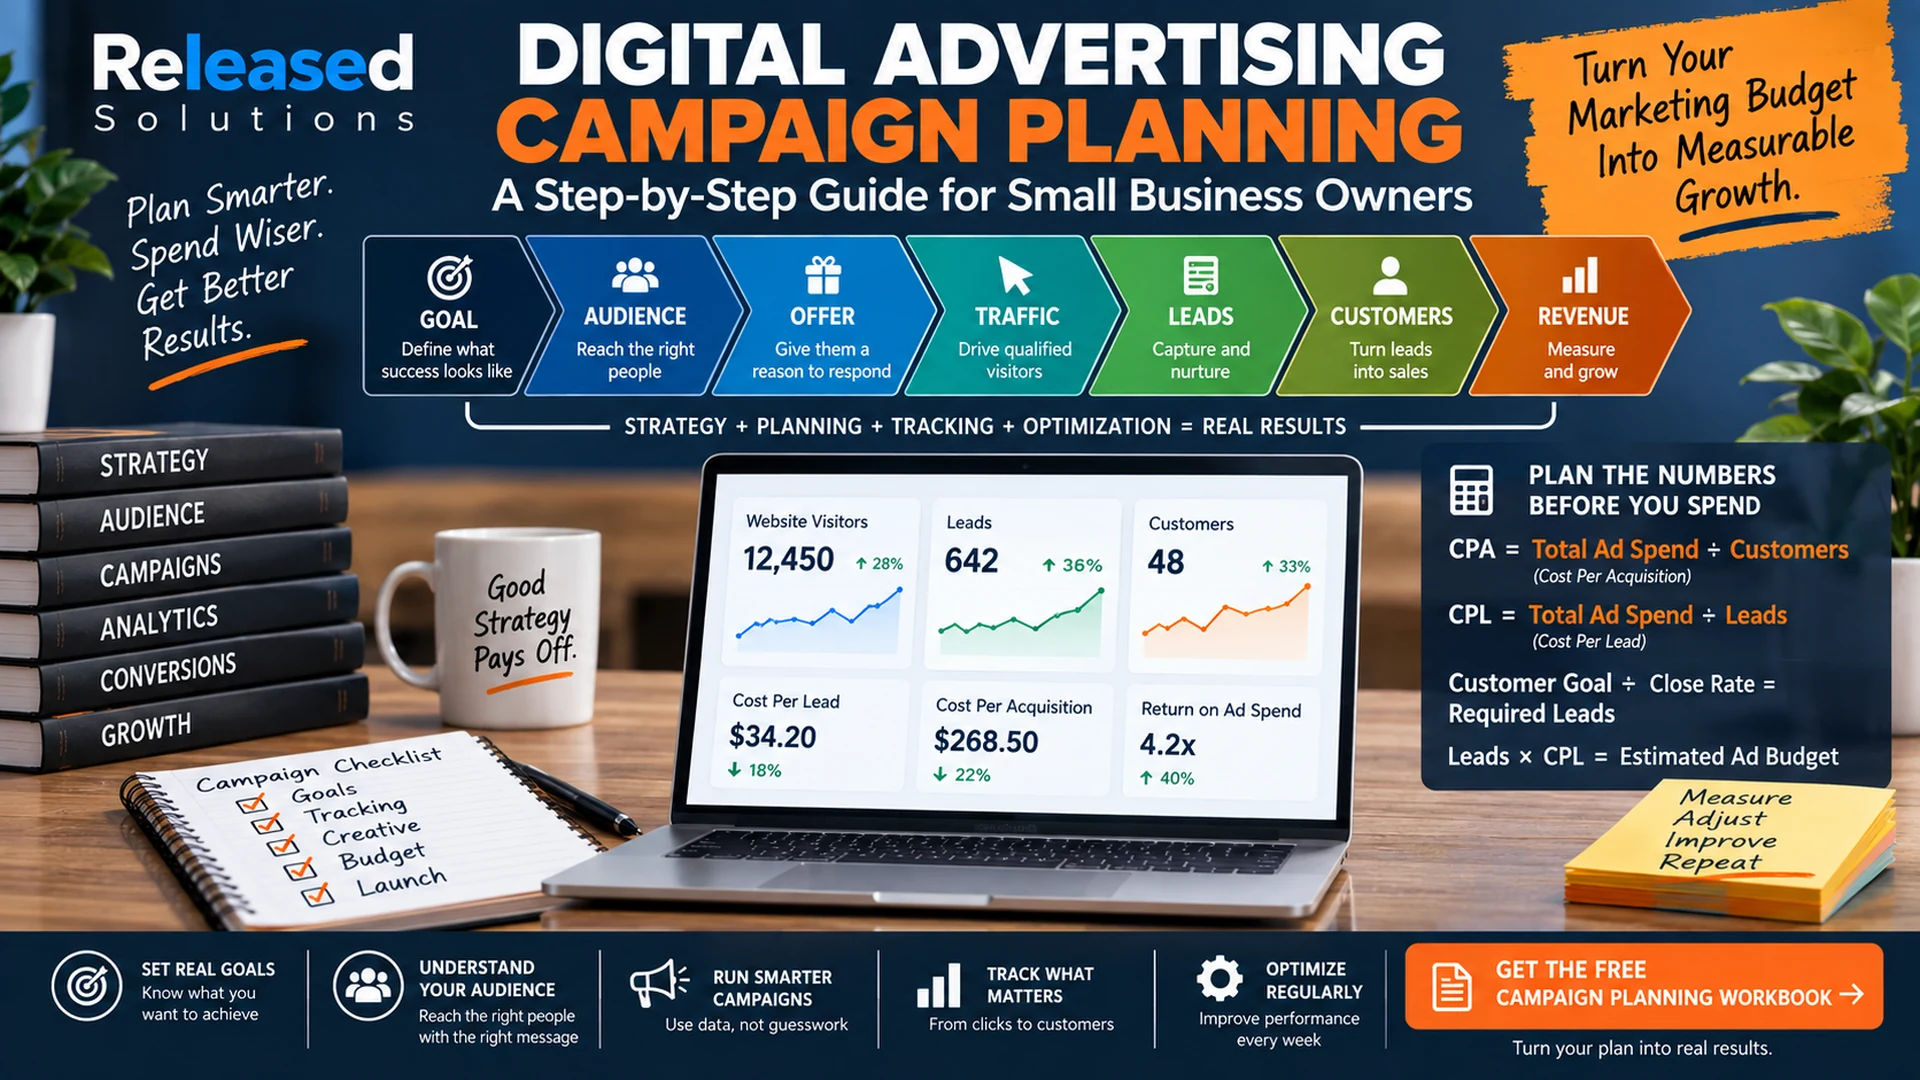

Digital Advertising Campaign Planning in 2026: A Small-Business Guide to Goals, Budgets, CPA and KPIs
Small-business owners often begin a digital advertising conversation with one question: "How much should I spend?"
That is an important question, but it is not the first question.
Before you decide what to spend on Google Ads, Meta, Microsoft Advertising, LinkedIn, or another paid channel, you need to know what the campaign is supposed to accomplish, what a valuable conversion looks like, how leads become customers, and what the business can afford to pay to acquire those customers.
Campaign planning is where those numbers meet the marketing strategy.
Before you ask how much advertising you can buy, define what success looks like and work backward from the business outcome.
Marketing Goals Come Before Advertising Goals
Advertising is a tool. The business goal determines what the tool needs to accomplish.
A restaurant may want more reservations. A contractor may need qualified estimate requests. A medical practice may need patient registrations. An ecommerce company may want profitable purchases. A B2B company may need sales-qualified opportunities.
Those are business outcomes. Impressions, clicks, and video views may help create those outcomes, but they are not interchangeable with them.
The Small-Business Campaign Planning Funnel
Every campaign has to answer these eight questions before media touches the market.
| Stage | Question | Example metric |
|---|---|---|
| Goal | What does the business want? | 20 new customers |
| Audience | Who is most likely to need the offer? | Qualified market / geography |
| Offer | Why should someone respond? | Consultation, purchase, appointment |
| Traffic | How many qualified visitors can we generate? | Clicks / landing-page sessions |
| Leads | How many visitors take the desired lead action? | Lead conversion rate / CPL |
| Qualified leads | How many leads are actually viable? | Lead qualification rate / CPQL |
| Customers | How many qualified leads become customers? | Close rate / CPA |
| Revenue | What economic value did the campaign create? | Revenue, ROAS, margin |
Work Backward From the Customer Goal
The easiest way to expose an unrealistic advertising goal is to work backward from the number of customers the business wants.
Suppose a business wants 20 new customers. Historically, 25% of its qualified leads become customers. It therefore needs about 80 qualified leads. If only half of incoming leads are qualified, the business needs about 160 total leads. If those leads can be acquired at an illustrative $40 cost per lead, the estimated media requirement would be $6,400.
That calculation does not guarantee that the market will deliver 160 leads at $40 each. It also shows why a small business marketing budget can be too small to succeed. It tells the business what the assumptions have to look like for the goal and budget to fit together.
| Planning step | Formula | Illustrative example |
|---|---|---|
| Required qualified leads | Customer goal / qualified-lead close rate | 20 / 25% = 80 |
| Required total leads | Required qualified leads / lead qualification rate | 80 / 50% = 160 |
| Estimated ad budget | Required leads × expected CPL | 160 × $40 = $6,400 |
| Estimated CPA | Estimated ad budget / expected customers | $6,400 / 20 = $320 |
Your close rate, qualification rate, CPL, CPA, margins, market demand, and sales capacity must come from your own data or clearly labeled assumptions.
Target Zone
Performance is within the planned range. Response: maintain, test carefully, and look for scalable opportunity.
Watch Zone
Performance is outside target but still economically tolerable. Response: diagnose traffic, conversion rate, lead quality, auction conditions, and sales follow-up.
Intervention Zone
Performance exceeds the business guardrail or tracking is unreliable. Response: reduce risk, fix the bottleneck, change the campaign, or stop scaling until the issue is understood.
CPA: The Number Every Small-Business Advertiser Should Understand
CPA usually means "cost per acquisition" or "cost per action," depending on what the campaign counts as the conversion. Google Ads defines average CPA as total conversion cost divided by the number of conversions.
For a small business, the first job is to define the action. Is the CPA measuring a lead, a booked appointment, a completed registration, a new customer, or a purchase? Those are very different economic outcomes.
If the business calls a form submission a "conversion," platform CPA may actually be a cost per lead. The business should continue measuring the funnel until it can calculate what it paid to acquire a real customer.
Core CPA and Capacity Formulas
| Formula | Calculation | What it tells you |
|---|---|---|
| Cost per lead (CPL) | Ad spend / total leads | What advertising paid for each lead |
| Cost per qualified lead (CPQL) | Ad spend / qualified leads | What advertising paid for each viable lead |
| Customer acquisition CPA | Ad spend / new customers attributed to the campaign | What media paid to acquire each customer |
| Blended acquisition cost | (Total sales + marketing acquisition cost) / new customers | A broader business acquisition cost when you want more than media-only CPA |
| Lead-to-customer rate | Customers / total leads | How efficiently leads become customers |
| Qualified-lead close rate | Customers / qualified leads | How efficiently sales converts viable opportunities |
| Lead qualification rate | Qualified leads / total leads | How much of the lead volume is actually useful |
| Budget acquisition capacity | Available ad budget / expected CPA | Approximate number of acquisitions the budget could support at that CPA |
| Required budget | Customer goal × acceptable CPA | Approximate media budget required if the CPA assumption holds |
For planning purposes, Released Solutions uses a Campaign Acquisition Profile (CAP): the customer goal, lead ratios, acceptable CPA, budget capacity, and conversion assumptions that must work together before media is scaled.
Build a Campaign Acquisition Profile (CAP)
The CAP is not an advertising-platform setting. It is a planning worksheet that captures the economics of the campaign in one place. It answers a practical question: if we spend this money, what must happen between the click and the customer for the campaign to make sense?
| CAP input | Example | Why it matters |
|---|---|---|
| Customer goal | 20 new customers | Defines the desired business outcome |
| Available ad budget | $6,400 | Defines media capacity |
| Expected CPL | $40 | Estimates lead volume |
| Lead qualification rate | 50% | Separates volume from quality |
| Qualified-lead close rate | 25% | Connects qualified leads to customers |
| Expected customer CPA | $320 | Connects spend to customer acquisition |
| Average first-sale revenue | $900 | Provides revenue context |
| Gross profit / contribution information | Business-specific | Helps determine whether the acquisition cost is sustainable |
| Sales capacity | Can team handle 160 leads? | Prevents marketing from creating operational failure |
How to Find an Acceptable CPA
There is no universal good CPA. A $100 CPA can be excellent for one business and impossible for another.
The maximum economically acceptable acquisition cost depends on customer value, gross profit or contribution margin, fulfillment costs, sales costs, repeat purchase behavior, and how quickly the business needs to recover the acquisition expense. A simple planning ceiling can begin with the amount of gross profit the business is willing to invest to acquire a new customer.
| Planning concept | Formula | Caution |
|---|---|---|
| Maximum acquisition allowance | Customer value available for acquisition × % business will invest | Use gross profit / contribution economics, not revenue alone |
| Break-even media CPA, simplified | First-sale contribution available after non-ad variable costs | A simplified planning threshold, not a full accounting model |
| Target operating CPA | Maximum acceptable CPA minus desired safety / profit buffer | Should reflect the business model and risk tolerance |
Do not decide that a $500 CPA is affordable simply because the average sale is $500. The business still has labor, product, overhead, sales, and fulfillment economics to consider.
Budget Is Capacity, Not a Promise
If the expected customer CPA is $200, a $5,000 media budget has a theoretical capacity of about 25 customer acquisitions. That is arithmetic, not a forecast.
The actual market may not contain enough qualified demand at that cost. Competition can change. Conversion rates can move. Creative can underperform. The landing page can become the bottleneck (see 5 Steps to Improve Your Website Conversion Rate). Sales can fail to close the leads (see Lead Nurturing).
The opposite is also true. Raising a budget ceiling does not force an advertising platform to find profitable demand that does not exist.
Campaign planning determines whether the goal, ratios, CPA assumptions, market opportunity, and budget can reasonably work together.
Know the Difference Between KPIs and Diagnostic Metrics
| Level | Examples | What it answers |
|---|---|---|
| Business outcomes | Customers, appointments, sales, revenue, acquisition cost, profit contribution | Did advertising help create the business result? |
| Campaign KPIs | Conversions, qualified leads, conversion rate, CPL, CPQL, CPA, ROAS | Is the campaign producing the intended outcome efficiently? |
| Diagnostic metrics | Impressions, reach, CPM, clicks, CTR, CPC, landing-page engagement | Where in the delivery or funnel might performance be improving or breaking? |
A high click-through rate can be useful, but it cannot rescue a campaign that produces unqualified leads. A low CPC can look efficient while the sales team receives nothing useful. More impressions can simply mean the campaign bought more exposure.
Diagnostic metrics help explain performance. Business outcomes determine whether performance matters.
Build the KPI Scorecard Before Launch
Every paid campaign should have a simple scorecard that connects platform activity to business outcomes. For most active small-business campaigns, review it weekly. For lower-volume campaigns where a single week does not provide enough conversion data, a biweekly decision review can be more useful while still monitoring delivery and tracking more frequently.
The point is not to change the campaign every seven days. The point is to create a management rhythm where the business sees the same numbers, asks the same questions, and records the decisions made.
| KPI | Target / guardrail | Decision / note |
|---|---|---|
| Ad spend | ||
| Impressions / reach | ||
| Clicks | ||
| CTR | ||
| CPC / CPM | ||
| Leads / primary conversions | ||
| Qualified leads | ||
| Lead qualification rate | ||
| CPL / CPQL | ||
| Customers / completed outcomes | ||
| Lead-to-customer rate | ||
| Customer CPA | ||
| Revenue / conversion value | ||
| ROAS, when applicable |
Monitor for broken tracking, runaway spend, or major delivery changes continuously. Use the scorecard to make disciplined decisions instead of reacting to every daily fluctuation.
Business Goal
The real-world outcome: customers, appointments, sales, revenue, registrations, qualified opportunities.
Marketing Goal
The behavior marketing must create to support that business outcome.
Campaign Goal
The specific conversion this ad campaign should generate and optimize toward.
KPI Target
The numbers that tell us whether the campaign is moving toward the goal at an acceptable cost.
Tracking Must Be Ready Before the Campaign
If the campaign is supposed to generate calls, forms, purchases, appointments, or registrations, those actions need to be measurable before media is scaled.
Google Analytics distinguishes ordinary events from key events that matter to the business, and advertising conversions used to measure and optimize campaigns. Google describes the progression as Event → Key Event → Conversion. That distinction is useful beyond Google: do not teach an advertising algorithm that every button click, scroll, or low-value action is equal to a real lead or customer.
Traffic Math Helps Explain the Funnel
Lead and customer goals can also be translated into approximate traffic requirements.
If a landing page converts 8% of qualified visits into leads and the campaign needs 160 leads, the planning model requires about 2,000 qualified visits. If the expected CPC is $3.20, that traffic would imply about $6,400 in media cost, consistent with the earlier $40 CPL assumption.
Again, this is a model. The real campaign determines whether those assumptions survive contact with the market.
| Formula | Example |
|---|---|
| Required traffic = required leads / landing-page conversion rate | 160 / 8% = 2,000 visits |
| Estimated spend = required clicks × expected CPC | 2,000 × $3.20 = $6,400 |
| Expected CPL = expected CPC / landing-page conversion rate | $3.20 / 8% = $40 |
Marketing Budget Calculator
What will your revenue goal really cost in ads?
Work backward from your revenue goal to the customers, leads, clicks and monthly ad budget it takes, using 2026 benchmarks for 23 industries.
Do Not Forget Sales Capacity and Lead Response
A campaign can succeed at generating demand and still fail as a business initiative if nobody answers the phone, leads wait days for a response, the sales team cannot handle the volume, or the CRM does not show what happened next.
Before scaling, ask whether the business can operationally absorb the acquisition volume implied by the plan.
What AI Changes About Campaign Planning
Advertising platforms increasingly use machine learning to decide bids, placements, audiences, and creative combinations. Google Target CPA, for example, is designed to seek as many conversions as possible around an advertiser-defined average acquisition target, while individual conversions can cost more or less than the target. Working with digital marketing and paid advertising partners familiar with these systems can help you set them up correctly.
This makes good inputs even more important. The platform needs the right conversion goal, reliable conversion data, sufficient creative, realistic budget constraints, and a business target that actually means something.
AI can help generate ideas, analyze performance, and produce creative variations. It cannot repair a campaign whose business goal, conversion definition, or economics were never established.
Make sure the conversion signal represents something the business actually wants more of.
The Pre-Launch Campaign Readiness Checklist
Ten items. If any of them are not true on launch day, the campaign is not ready.
Goal Defined
The business outcome and primary campaign conversion are written down.
Audience Defined
Geography, customer profile, demand, and exclusions are understood.
Offer Ready
The reason to respond is clear and competitive.
Funnel Math Completed
Lead ratios, close rates, CPA assumptions, and traffic requirements are documented.
CAP Completed
Customer goal, acceptable CPA, budget capacity, and economic guardrails are recorded.
Tracking Tested
Analytics, conversion tracking, CRM routing, and offline outcomes are ready.
Creative Ready
The campaign has enough relevant assets for the channels being used.
Landing Experience Ready
The page works, loads properly, and makes the next action obvious.
Sales Process Ready
Ownership, response time, and qualification process are established.
KPI Scorecard Ready
Targets, guardrails, weekly or biweekly review cadence, and decision owners are established.
Digital Advertising Campaign Readiness Workbook
The CAP worksheet, funnel math, KPI scorecard, and 10-item pre-launch checklist in one printable PDF. Free download, no form.
The Takeaway
Digital advertising should not begin with an ad.
It should begin with a business objective and a set of numbers that explain how advertising can contribute to that objective.
Know how many customers you want. Know how leads become customers. Know what you can afford to pay. Know what the budget can theoretically support. Know what will be measured. Then launch, review the KPI scorecard, and improve the campaign based on evidence.
Last fact-check: September 2026
Get Your Campaign Ready Before You Spend
Released Solutions helps small businesses plan, launch, measure, and optimize digital advertising across the customer journey.
If you have a budget and a goal but the numbers between them are not connected yet, we can help you build the CAP, tracking, and scorecard before media goes live.
A campaign is only as strong as the plan behind it.
Kenneth Durrum, Released Solutions