

Claude Artifacts for Business: Make the Work Easier to Review
Claude Artifacts for business are useful when they turn an AI conversation into something you can inspect, edit or use. The right output might be a document, a comparison table, a chart or a small interactive tool. Choose the format that helps you do the next part of the job.
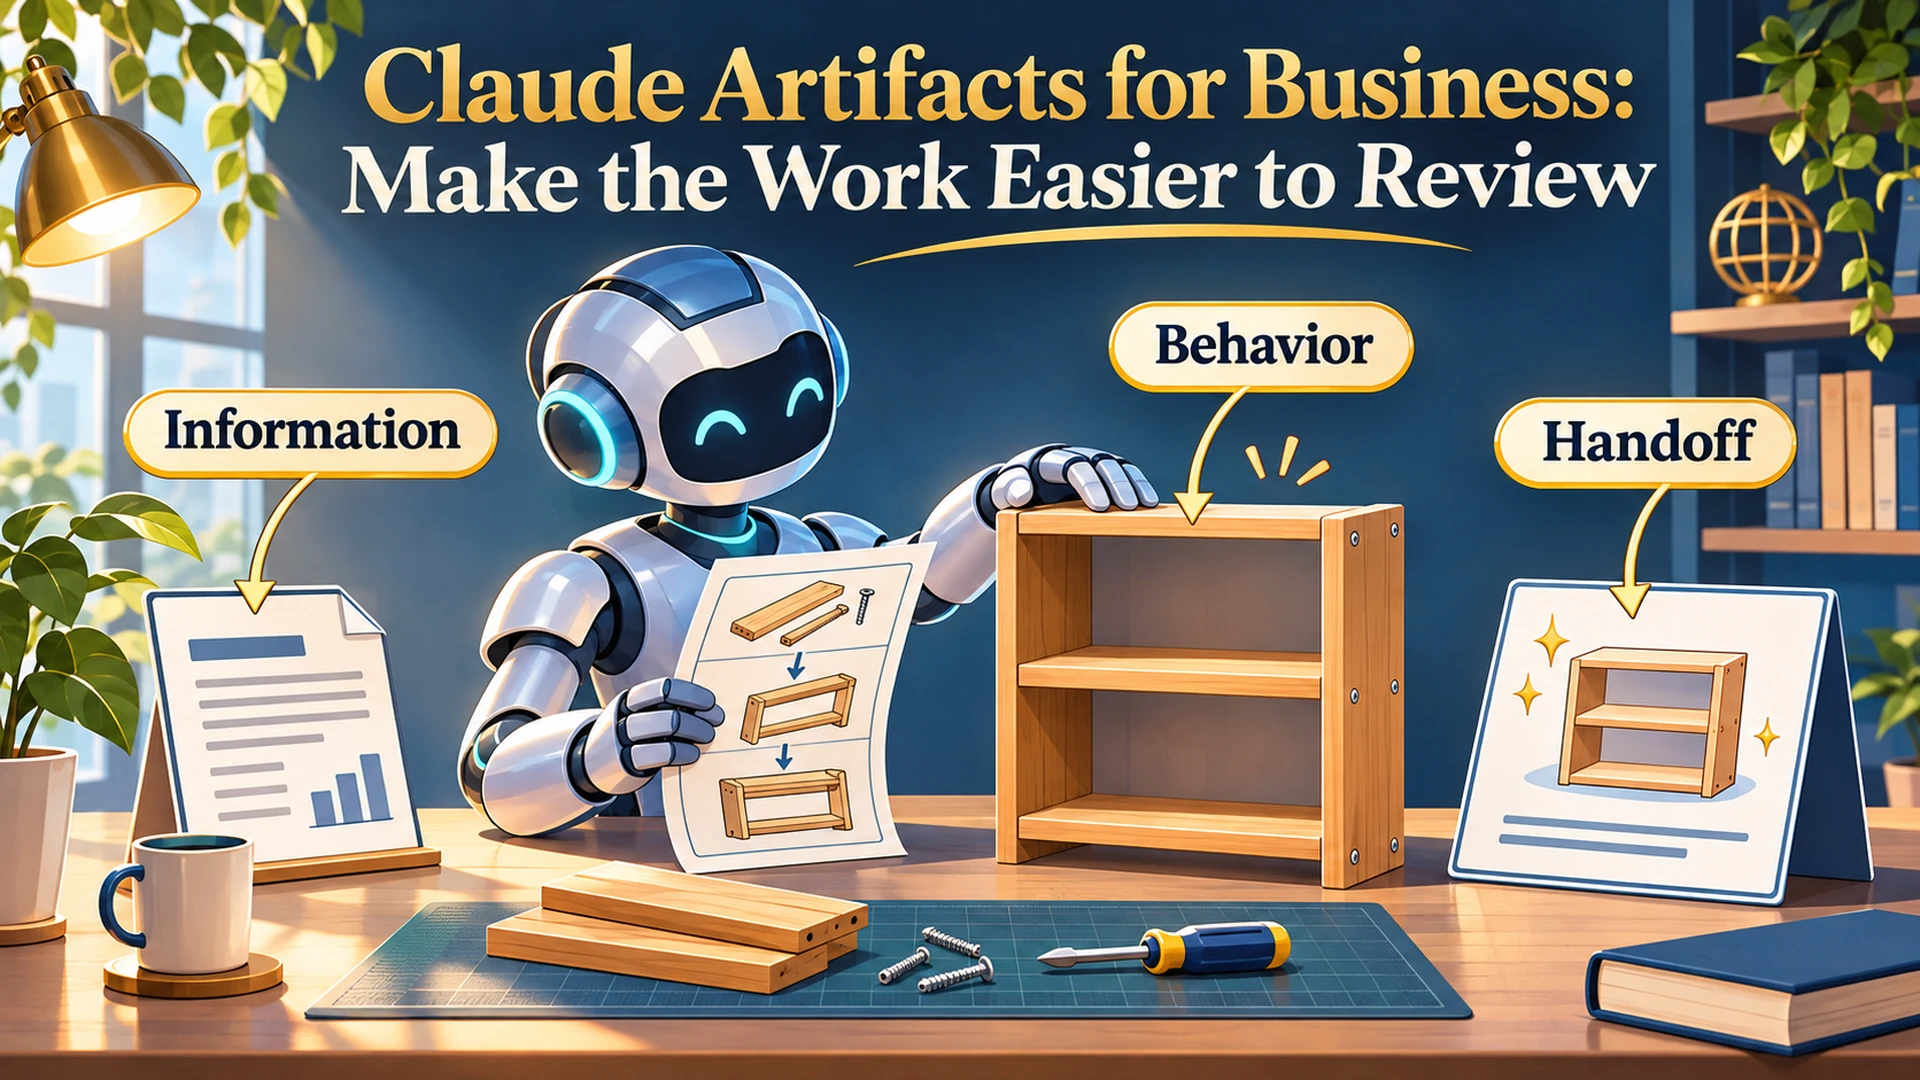
Think about assembling a piece of furniture. Written instructions explain the steps, but an illustration can make it obvious which way the shelf should face. Neither one helps much if the picture shows six screws and the bag contains four.
AI output works much the same way. Presentation can make the work easier to understand, but you still need to check what you have been given.
This is Part 4 of Put AI to Work. We have covered defining the assignment and choosing a direction. Now we need to decide what the result should look like so someone can review it and move forward.
What Are Claude Artifacts for Business?
Claude Artifacts are outputs you can work with alongside the conversation, such as documents, diagrams, dashboards and small interactive tools. For a business owner, their value depends on whether that output makes an actual task easier to complete.
Anthropic’s guide to creating and using Artifacts explains how these outputs can be edited, revisited and shared. The available features depend on the type of artifact, your plan and relevant settings.
The practical question comes before the product feature: what does the person receiving this work need to do?
Reading a recommendation, comparing three proposals and testing a pricing assumption are different activities. They may need different formats even when they begin with the same information.
Why Does the Output Format Matter?
The format determines how easily you can find information, compare alternatives and spot problems. A useful format brings the important relationships into view without hiding the detail needed to check them.
A long explanation may contain everything you requested. That does not mean you can quickly tell which proposal includes setup, which campaign needs attention or which step has no owner.
I have already described how a Google Search Console checklist became an app. That project is one example of moving beyond a written answer toward something useful in the workflow.
It does not follow that every checklist needs to become an application. Sometimes a table with five clear columns does the job perfectly well.
The format earns its place when it reduces the effort required to understand or use the work.
Which Format Should You Ask AI to Create?
Choose the format around the reader’s next action. Use prose for explanation, tables for comparison, charts for numeric patterns, diagrams for relationships and interactive tools for exploring changing inputs.
These are starting points. A finished report may combine several formats, with each one doing a specific job.
| What the reader needs to do | Useful starting format | What to check |
|---|---|---|
| Understand a recommendation | Short document | Does it explain the evidence, reasoning and next step? |
| Compare options against the same criteria | Table | Are the criteria consistent and missing details visible? |
| See a numeric trend or difference | Chart with supporting data | Are the values, units, periods and scale correct? |
| Follow steps, responsibilities or decisions | Workflow diagram | Are the sequence, owners and decision points accurate? |
| Explore how changing an input affects a result | Spreadsheet or interactive tool | Are the formulas, assumptions and controls correct? |
Ask for the simplest format that supports the decision. You can add another view when it answers a question the first one cannot.
A three-page explanation of three comparable prices may be asking the reader to build a table in their head. Let AI build the table instead.
What Would This Look Like in a Marketing Report?
A useful AI-generated marketing report should help its reader identify what changed, what needs checking and what action is appropriate. A collection of colorful charts is only useful if it helps answer those questions.
Consider a hypothetical business reviewing three advertising campaigns. The owner has supplied a spreadsheet containing spend, recorded leads and reporting dates.
A workable output could contain three parts:
A comparison table:
campaign, spend, recorded leads and cost per recorded lead.
A chart:
the same cost-per-lead comparison, with readable campaign names and units.
A short decision note:
what deserves investigation, what information is missing and what should happen next.
The table lets someone inspect the figures. The chart makes the difference easier to see, and the note explains what the comparison can support.
If the file contains recorded leads but no information about lead quality, the report should say so. A cheaper recorded lead does not tell you whether that person became a suitable customer.
That limitation belongs beside the recommendation. Otherwise, the visual presentation can make an incomplete conclusion look settled.
What Should You Tell AI Before It Builds the Output?
Tell AI who will use the result, what they need to decide, which sources to use and how the work will be checked. Specify the required content before asking for visual polish.
Your AI task brief and acceptance checks provide the foundation. The output format is part of that assignment, alongside the inputs, boundaries and finished destination.
For the hypothetical report, you could use this prompt:
Use the supplied campaign spreadsheet to prepare a weekly review for a small-business owner.
Create a comparison table showing each campaign’s spend, recorded leads and cost per recorded lead. Use the reporting dates in the file. Flag missing information and explain how you handled any zero-lead campaign.
Add one chart comparing cost per recorded lead. Show the currency, campaign names and reporting period clearly.
Follow it with a short note explaining what deserves investigation and what information would be needed before changing the budget. Do not infer lead quality, sales or profitability from lead counts.
Check that every displayed value agrees with the source file. Separate observations supported by the data from possible explanations.
This gives AI a reason for each element. It also gives you a basis for rejecting a result that looks finished but leaves out an essential check.
You can request colors and branding afterward. First, make sure the right information is on the page.
When Is an Interactive Tool Worth Building?
An interactive tool is useful when changing an input helps someone understand a decision, or when a recurring task involves repeated calculations or choices. It needs a clearer purpose than making a static report feel more impressive.
Imagine a hypothetical campaign-planning worksheet. The owner changes the proposed budget and an assumed cost per lead, then sees how those assumptions affect the estimated lead count.
That can help explain the relationship between the inputs. It does not predict actual campaign performance, so the output should label the result as an estimate based on the entered assumptions.
Before asking AI to build the tool, decide:
✓ Which inputs can the user change?
✓ What calculation connects those inputs to the result?
✓ Which assumptions must remain visible?
✓ What should happen when an input is blank, zero or invalid?
✓ Does anyone need to save or share the result?
That last question matters. A working preview does not establish that information will still be there after someone closes the page.
Ask how saving works, then test the behavior you need. Keep the first version small enough that you can understand what it does.
The Caveman Marketing Quiz
How much of your marketing is still hunting by hand?
Rate 15 statements and see which of five stages your marketing is in, from The Hunter to The AI-Augmented Entrepreneur.
How Do You Check an AI-Generated Visual or Tool?
Check the information, the behavior and the handoff. A useful output needs correct content, working interactions and a dependable way for its intended user to access it.
My approach to checking AI-generated work before relying on it applies just as much to a polished dashboard as it does to a paragraph.
Check the Information
Trace important figures and claims back to the supplied sources. Confirm the dates, units, definitions and calculations, and make sure missing information has not quietly become an invented value.
For a chart, compare its plotted values with the underlying table. Check whether its scale and labels give the reader a fair understanding of the difference.
Check the Behavior
For an interactive tool, try ordinary inputs and the awkward ones. Test blank fields, zero values and numbers outside the expected range.
Check the result independently for a few examples. A button changing something on the screen does not establish that the calculation is correct.
Check the Handoff
Open the exported file or shared result the way its recipient will. Check readability, links, permissions and any required saving behavior.
If the owner needs an editable spreadsheet, a screenshot of the spreadsheet has not completed the assignment. If staff need to use a checklist on their phones, check it on a phone.
What If a Simple Document Is Enough?
Use the document. A clear page can be the most useful result when the task involves reading, approving or following instructions that do not need interactive controls.
The broader AI workflow for small business includes review and delivery. Those steps should influence the format you choose.
A document may be easier to distribute, print, archive and update. A table may be easier to check than a dashboard, especially when there are only a few items to compare.
You do not need to turn the office supply list into mission control. Give the reader what helps them do the job.
Frequently Asked Questions About AI Outputs
Should Every AI Response Become an Artifact?
No. A conversational answer may be enough for a quick explanation or a small decision. A separate output becomes useful when you need to review, edit, reuse or hand over something that stands on its own.
Does an AI-Generated Dashboard Update Automatically?
Do not assume it does. Confirm where the data comes from, how updates are triggered and how the output shows its latest refresh. A dashboard created from an uploaded file may represent that file’s contents rather than current business activity.
Can an AI-Generated Tool Replace Existing Business Software?
Sometimes a small tool can handle a narrow task, but that decision requires more than a successful demonstration. Consider the records, access, reliability, maintenance and support the business needs before depending on it.
Choose an Output Someone Can Use
Take one AI response you currently have to reread, reorganize or explain to someone else. Identify the next action, then ask for the format that makes that action easier.
A table might expose a missing comparison. A diagram might reveal an unclear handoff, or a small calculator might make an assumption easier to test.
The furniture instructions still need to match the parts in the bag. Give AI a clear assignment, choose a useful view and check that the result holds together.
If you want help applying this to your own marketing or business processes, explore practical marketing and AI coaching. We can work through a real task and choose an output you can review, use and repeat.
Last fact-checked: November 9, 2026.